Returning diagnostics and runtime information in a Nodejs application
If you’re a little bit like me , you favor having a way of diagnosing your applications without needing to start a debug. This is particularly useful when your application is running in an environment that cant be debugged locally or where faults and issues are only present at runtime.
I often enjoyed concepts like self healing applications and software that could provide diagnostics and metrics and a snapshot of its environmental config at runtime so that you could diagnose problems or build intuitive alerts and procedures without needing to invest in an APM.
Although I would recommend investing in an APM and having a mature and predictable observability framework , I also love to build simple developer tools and functions to help me debug and diagnose locally without too much overhead.
That being said , one of my favorite finds , was that NodeJS provides a built in diagnostic report which can be used to get a rich and detailed set of information and provide you with a comprehensive report of the environment your NodeJS application is running on.
That’s enough waffling , lets get started on the implementation and you will get to see how this all works.
Creating the initial infrastructure
Firstly you wanna bootstrap a simple NodeJS application , this can easily be done by opening up a terminal in the directory you would like to create this application and running the two commands below.
Note: This blog assumes you have a basic understanding of NodeJS and have the runtime already installed.
npm init Follow the prompts , pressing enter is sufficient but if you prefer you can fill in some basic information like a name and description for this app.
npm install expressThis sets up all the dependencies we need for our skeleton and allows us to continue with the rest of the implementation unimpeded.
The next step is to create an index.js file in the directory where you ran your previous commands
Note: This step could also have been easily done via the terminal but depending on the type of terminal , the commands differ slightly.
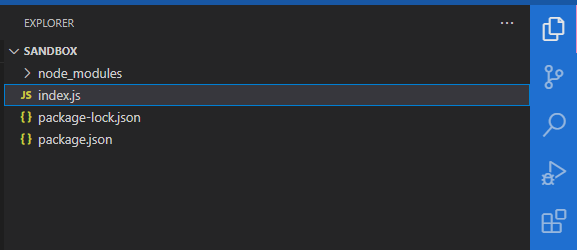
If you’ve followed along successfully , your directory should look like this

Your package.json will look like this
{
  "name": "diagnostics",
  "version": "1.0.0",
  "description": "Getting runtime and machine diagnostics",
  "main": "index.js",
  "scripts": {
    "test": "echo \\"Error: no test specified\\" && exit 1"
  },
  "author": "Yashlin Naidoo",
  "license": "ISC",
  "dependencies": {
    "express": "^4.21.1"
  }
}
And of course your index.js file will be empty
Setting up the initial functionality
Now that we have our basic infrastructure we can start adding some functionality
In our index.js we can require the following packages and set the port to our port of choice for running locally, keeping in mind to choose a port that isn’t currently in use. This will set up the basic implementation we need for running a local development server using express and nodejs.
const express = require('express');
const app = express();
const port = 9500;
Next we can set up some minor logic on the built in process.report object that will allow us to use the functionality properly.
// Enable process reporting if not already enabled
if (!process.report) {
    throw new Error("process.report is not supported in your Node.js version");
}

// Setup process report properties
process.report.directory = './'; // Directory where the report will be saved
process.report.filename = 'diagnostic-report'; // Base name for the report file
Adding our express routes
The next step is to add our express routes which will allow us to call this functionality as endpoints giving us the ability to call this report on demand as well as save it within our NodeJS application so that we can have a record of it for deep offline analysis if required.
Note: While this functionality works very well in all environments I would recommend using it only in dev/test environments as the report can expose the environment details and runtime paths which can have sensitive information. If you are keen on running it in production , please make sure to scrub out sensitive information before returning the diagnostic result.
// Endpoint to return diagnostics
app.get('/diagnostics', (req, res) => {
    try {
        // Trigger the report and capture it as an object
        const report = process.report.getReport();

        res.json(report);
    } catch (error) {
        res.status(500).json({
            error: 'Failed to generate diagnostics report',
            details: error.message,
        });
    }
});

// Endpoint to save the report to a file
app.get('/diagnostics/save', (req, res) => {
    try {
        // Trigger and save the report to a file
        const reportFilePath = process.report.writeReport();
        res.json({ message: 'Report saved', path: reportFilePath });
    } catch (error) {
        res.status(500).json({
            error: 'Failed to save diagnostics report',
            details: error.message,
        });
    }
});

app.listen(port, () => {
    console.log(`Diagnostics app running at <http://localhost>:${port}`);
});
Key Features of process.report
process.report.getReport():- Generates a diagnostics report in memory.
- Returns an object containing details about the process environment, Node.js runtime, memory usage, loaded libraries, and more.
process.report.writeReport([filename]):- Writes a diagnostic report to the file system.
- If no filename is provided, it uses
process.report.filenameandprocess.report.directory
When we are done , our index.js will look like this.
const express = require('express');
const app = express();
const port = 9500;

// Enable process reporting if not already enabled
if (!process.report) {
    throw new Error("process.report is not supported in your Node.js version");
}

// Setup process report properties
process.report.directory = './'; // Directory where the report will be saved
process.report.filename = 'diagnostic-report'; // Base name for the report file

// Endpoint to return diagnostics
app.get('/diagnostics', (req, res) => {
    try {
        // Trigger the report and capture it as an object
        const report = process.report.getReport();

        res.json(report);
    } catch (error) {
        res.status(500).json({
            error: 'Failed to generate diagnostics report',
            details: error.message,
        });
    }
});

// Endpoint to save the report to a file
app.get('/diagnostics/save', (req, res) => {
    try {
        // Trigger and save the report to a file
        const reportFilePath = process.report.writeReport();
        res.json({ message: 'Report saved', path: reportFilePath });
    } catch (error) {
        res.status(500).json({
            error: 'Failed to save diagnostics report',
            details: error.message,
        });
    }
});

app.listen(port, () => {
    console.log(`Diagnostics app running at http://localhost:${port}`);
});
Testing our endpoints
We can start our application by opening up a terminal in the root of the directory our application is located and then typing in the following command
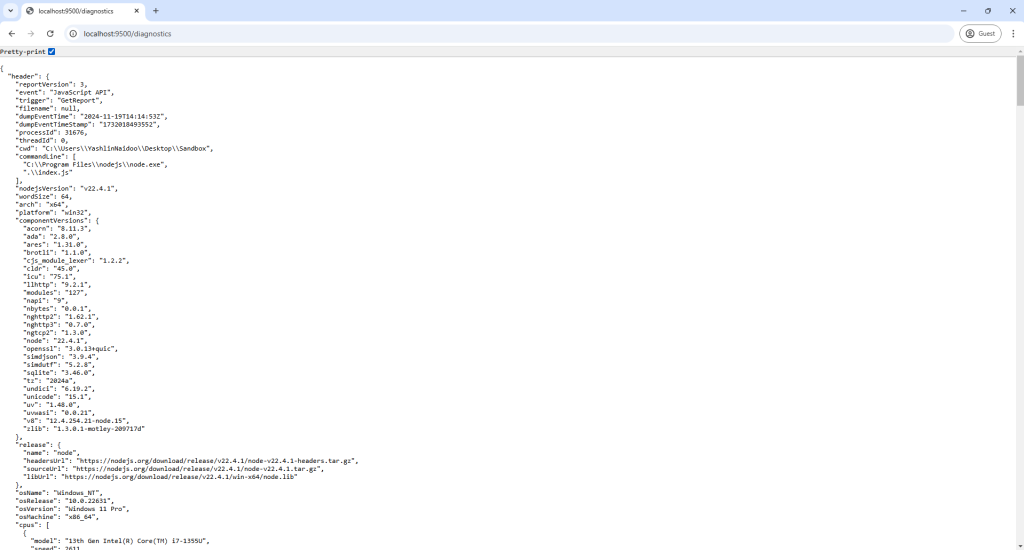
node index.jsWe can then call our endpoints by navigating to our favorite browser and pasting our endpoint in the URL bar , because both of these are GET endpoints we can quickly test them in our browser without needing to install or run API testing tools.
http://localhost:9500/diagnostics
Note: your port might not be 9500 and could be different depending on what you chose

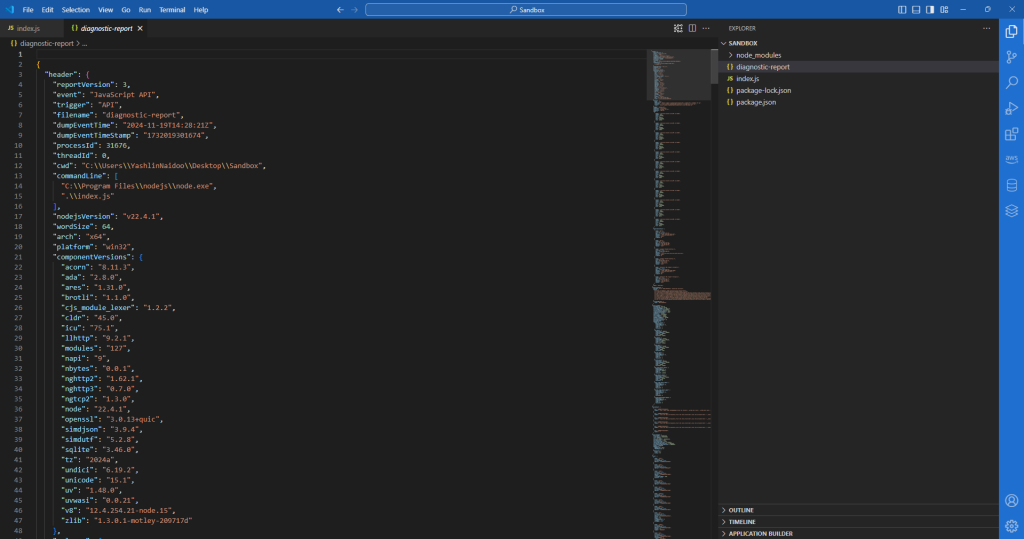
And then calling the save endpoint
http://localhost:9500/diagnostics/save

Which will save the report in your directory where your index.js is located

Conclusion
Nodejs and a lot of other frameworks and runtimes sometimes have a lot of functionality that is not always obvious , reading documentation and playing around on the internet can give you access to a whole world of interesting tools and functions that provide a variety of interesting and useful capabilities.
The NodeJS process report can be very useful for a variety of different use cases and the fact that its built in and only a few lines of code to make use of is a tremendous advantage.
